
Telemetry on Cisco MDS Explained & Configuration
Contents
SAN Analytics Overview
The SAN Analytics feature allows you to monitor, analyze, identify, and troubleshoot performance issues on Cisco MDS switches. For a list of supported switches, see the Hardware Requirements for SAN Analytics.
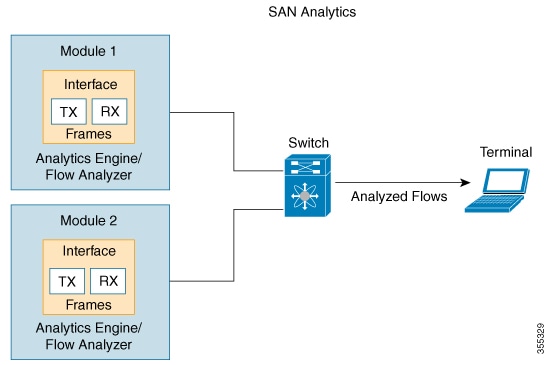
The SAN Analytics feature monitors flows bidirectionally, correlates the flows in a network processing unit (NPU) within a module or individual switch, and provides the fully analyzed network data to the user.
SAN Analytics Components and Querying methods
The SAN Analytics feature collects flow metrics using frames of interest, for data analysis, and includes the following components:
- Data Collection: The flow data is collected from NPU and eventually sent and stored on the supervisor of a switch. The data that is displayed is the real time view of the data and does not display historical data.
- On-board Querying: The data that is stored in a database can be extracted using a pull query, a push query, or overlay CLIs. Queries are used to extract the flow metrics of interest from the database. The frames of interest are used to monitor, analyze, and troubleshoot performance issues on a switch. For more information.
- The following are the different ways of querying the database:
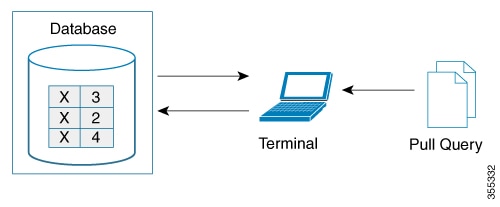
- The pull query: is a one-time query that is used to extract the flow information that is stored in the database at the instant the query is executed. The output is in JSON format. Pull queries are NX-API compliant.The overlay CLI ShowAnalytics command is a python script that issues a predefined pull query that displays the flow metrics in a user-friendly tabular format. It is a CLI wrapper that is written in Python and stored in the bootflash for execution.From Cisco MDS NX-OS Release 8.3(1), the following options are supported in a pull query:
- Clear—Clears all minimum, maximum, and peak flow metrics.
- Differential—Returns the absolute value of only the ITL or ITN flow metrics that were updated between the last and the present streaming intervals. We recommend that you use the differential query to improve scale values of your switch.
- The pull query: is a one-time query that is used to extract the flow information that is stored in the database at the instant the query is executed. The output is in JSON format. Pull queries are NX-API compliant.The overlay CLI ShowAnalytics command is a python script that issues a predefined pull query that displays the flow metrics in a user-friendly tabular format. It is a CLI wrapper that is written in Python and stored in the bootflash for execution.From Cisco MDS NX-OS Release 8.3(1), the following options are supported in a pull query:
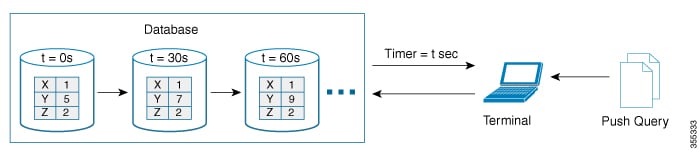
- Push query: A recurring query that is installed to periodically extract the flow metrics that are stored in the database and send them to a destination. The output is in JSON format.From Cisco MDS NX-OS Release 8.3(1), the following options are available in a push query:
- Clear—Clears all minimum, maximum, and peak flow metrics.
- Differential—Returns the absolute value of only the ITL or ITN flow metrics that were updated between the last and the present streaming intervals. We recommend that you use the differential query to improve scale values of your switch.
Port-Sampling Scenarios
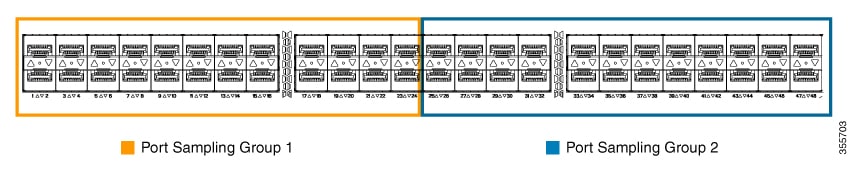
Let us consider a module consisting of 48 ports and group them into two subsets of 24 ports. Depending on the port-sampling intervals that are configured for these subsets of ports and the streaming-sample interval that is configured, flow metrics can be captured at different intervals as seen in the following examples:
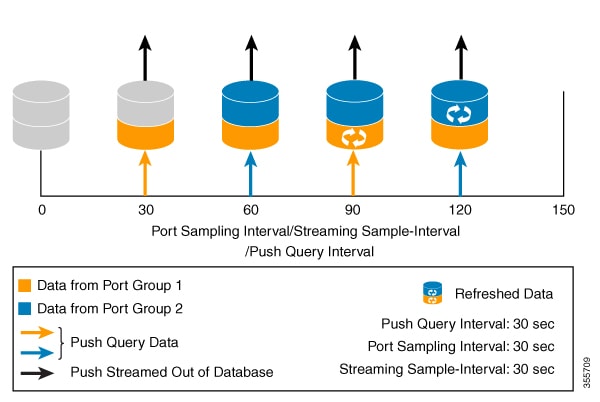
- When the port-sampling interval and the streaming-sample interval start at a different time

MDS port Sampling Configuration:
The Port Sampling feature allows you to gather data from a subset of ports in a module that is being monitored, cycle through multiple subsets of ports, and stream data from these ports at a regular port-sampling interval.
The following commands are introduced:
- analytics port-sampling module number size number interval seconds
- show analytics port-sampling module number
We recommend that the streaming-sample interval (snsr-grpidsample-intervalinterval ), port-sampling interval (analytics port-sampling modulenumbersizenumberintervalseconds ), and push-query interval (analytics query“query_string”namequery_nametype periodic [intervalseconds] [clear] [differential] ) be configured with the same value. We also recommend that you change or configure the push-query interval first, then the port-sampling interval, and finally, the streaming-sample interval.
Example (version 8.4(0)SK(1)):
feature analytics
analytics port-sampling module 4 size 12 interval 30

analytics query "select all from fc-scsi.scsi_target_itl_flow" name VI_scsi type periodic interval 30  differential clear
analytics query "select all from fc-nvme.nvme_target_itn_flow" name nvme-184 type periodic interval 30  differential clear

interface fc4/25
  analytics type fc-scsi

interface fc4/26
  analytics type fc-nvme

interface fc12/44
  analytics type fc-scsi
  analytics type fc-nvmeCode language: JavaScript (javascript)
Limitation for SAN Analytics:
- This feature has the following restriction about queries:
- The maximum number of push queries is eight. For information about push queries, see Information About SAN Analytics.
- Does not support clearing and purging of individual metrics. For information about clearing and purging metrics.
- The where condition in the query syntax can accept only the equal (=) operator. For more information, see Query Syntax.
Command Changes:
| Cisco MDS NX-OS Release 8.2(1) | Cisco MDS NX-OS Release 8.3(1) |
|---|---|
| analytics query “query_string” type timer timer_val | analytics query “query_string” namequery_nametype periodic[interval seconds][clear][differential] |
| clear analytics “query_string” | clear analytics query“query_string” |
| purge analytics “query_string” | purge analytics query“query_string” |
| show analytics query {“query_string” | id result} | show analytics query {“query_string”[clear][differential] | all | namequery_nameresult} |
Reference:
cisco.com/c/en/us/td/docs/switches/datacenter/mds9000/sw/8_x/config/san_analytics/cisco-mds9000-san-analytics-telemetry-streaming-config-guide-8x/configuring-san-analytics.html
![OSPF DR and BDR Election Explained [with Configuration]](https://learnduty.com/wp-content/uploads/2022/03/image-33.png?v=1647900046)
![OSPF Neighbor Adjacency Requirements [With Configuration]](https://learnduty.com/wp-content/uploads/2022/03/image-23-418x450.png?v=1647900064)
![OSPF Neighbor States Explained [Step by Step]](https://learnduty.com/wp-content/uploads/2022/03/image-13.png?v=1647900076)
![OSPF Area Types Explained and Configuration [Demystified]](https://learnduty.com/wp-content/uploads/2022/03/image-8.png?v=1647900083)